Useful performance testing is controllable, user-impacting, and reproducible. At Emerge, our cross-platform tooling has helped popular apps with millions of users improve app launch and fix regressions before ever reaching production. Here's a look at our Android performance tooling.
How it Works
One of the biggest challenges with performance testing is reaching statistical significance. The speed of critical application flows (like app launch) can be impacted by many factors: a device's thermal state, battery, network conditions, disk state, etc. This all contributes to a high degree of variance in testing, making it difficult to reach confident conclusions.
Emerge isolates each performance test on a dedicated, real device. Conditions like the CPU clock speed, battery, network and more are normalized. The same test is run up to a hundred times, alternating between app versions to detect differences.
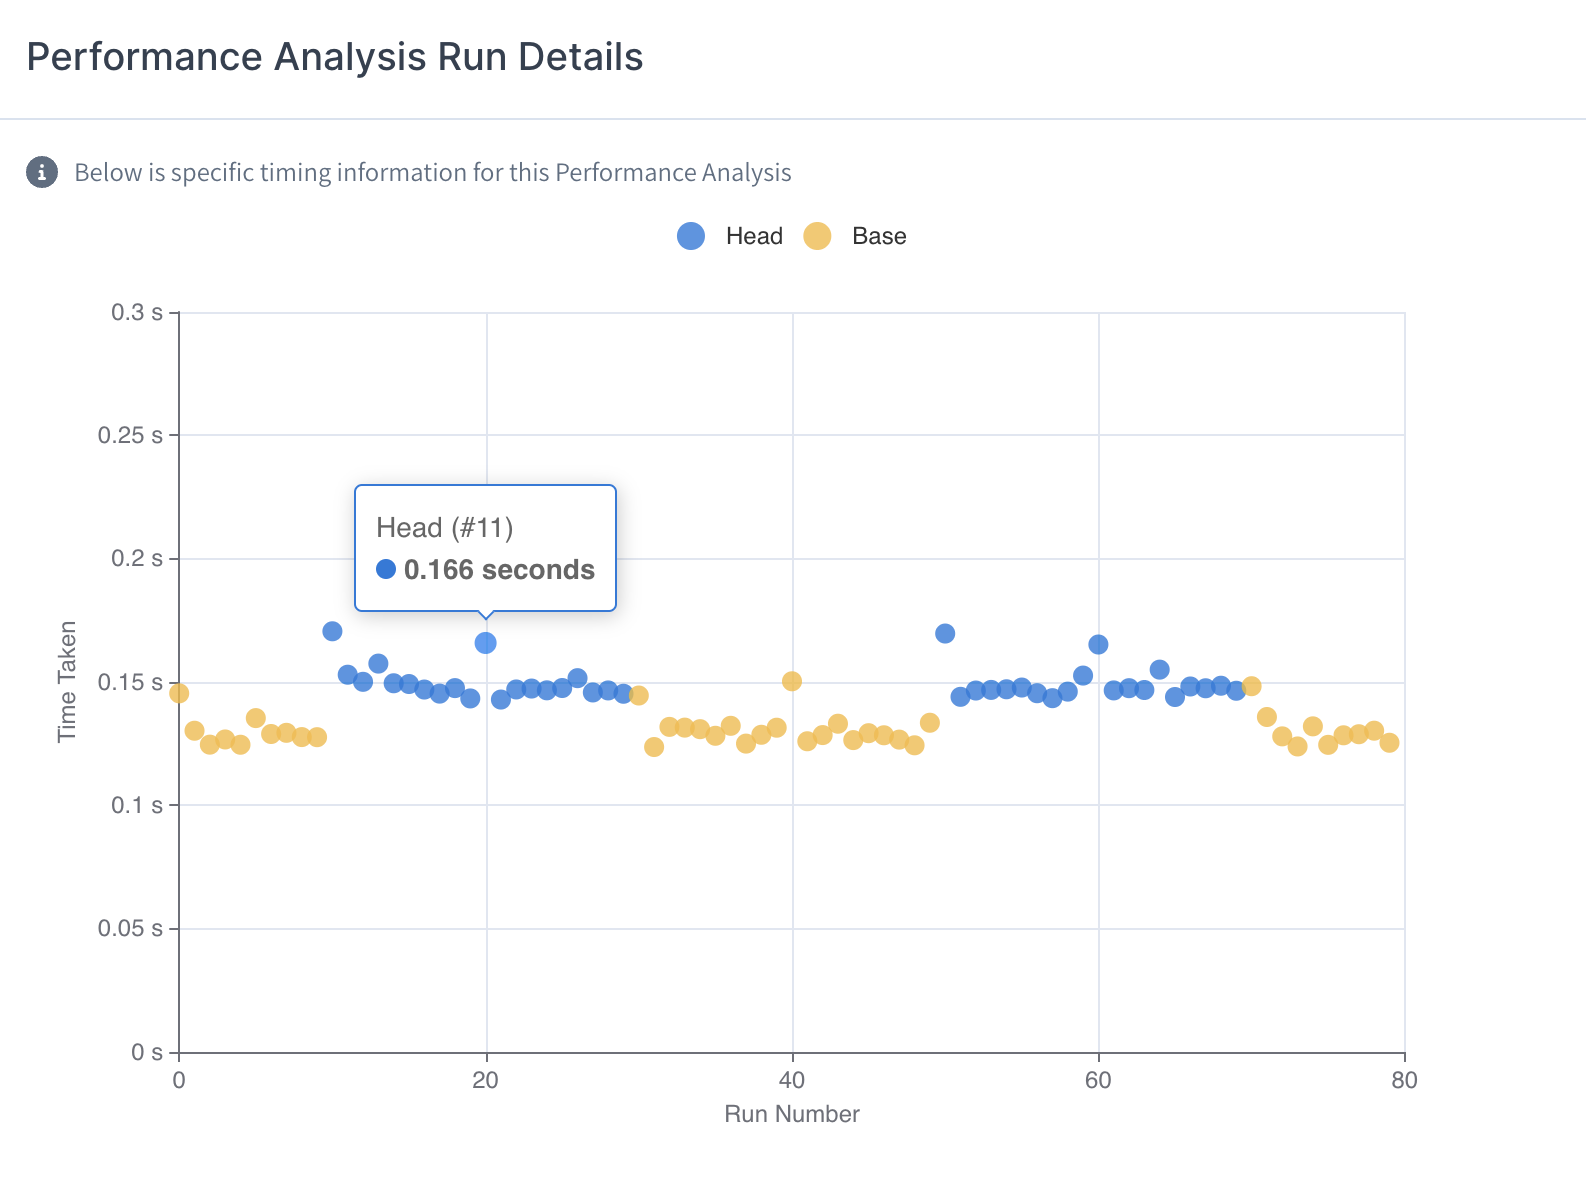
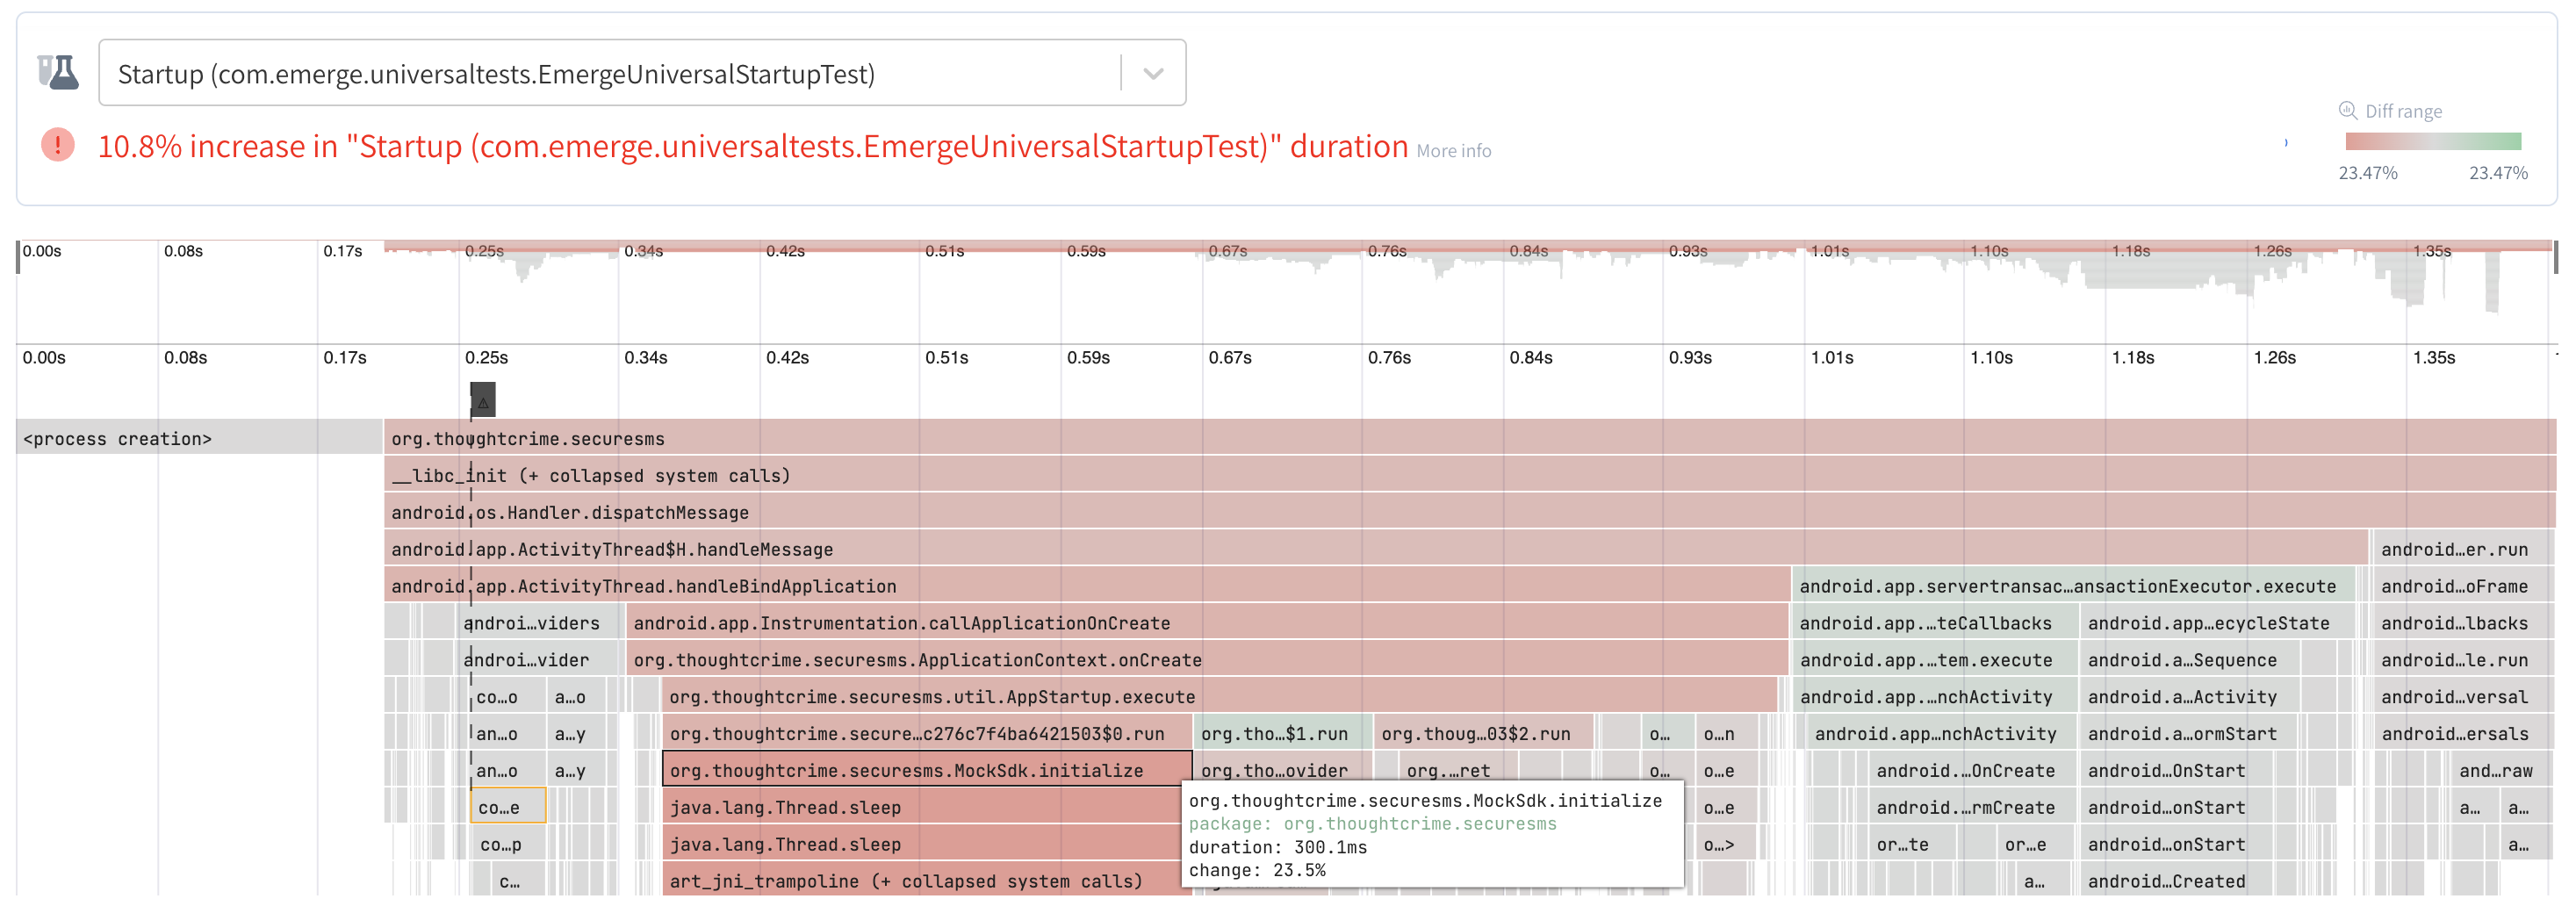
The result is a 99% confidence interval about whether a specific code change has improved, regressed or had no impact on the flows being tested. A differential flame chart is generated to easily pinpoint the functions that contributed to the change:
This blog walks through the process of setting up Emerge performance testing on Firefox (open-source) and comparing flows across builds.
Adding Emerge to Firefox
Our first step is to apply and configure the Emerge Gradle plugin:
1// Top-level build.gradle
2
3plugins {
4    id("io.gitlab.arturbosch.detekt").version("1.19.0")
5    id("com.emergetools.android").version("1.2.0")
6}
7
8emerge {
9    appProjectPath = ':app'
10    apiToken = System.getenv("EMERGE_API_KEY")
11}
12
With the Gradle plugin, we can use ./gradlew emergeUploadReleaseAab to easily upload a build.
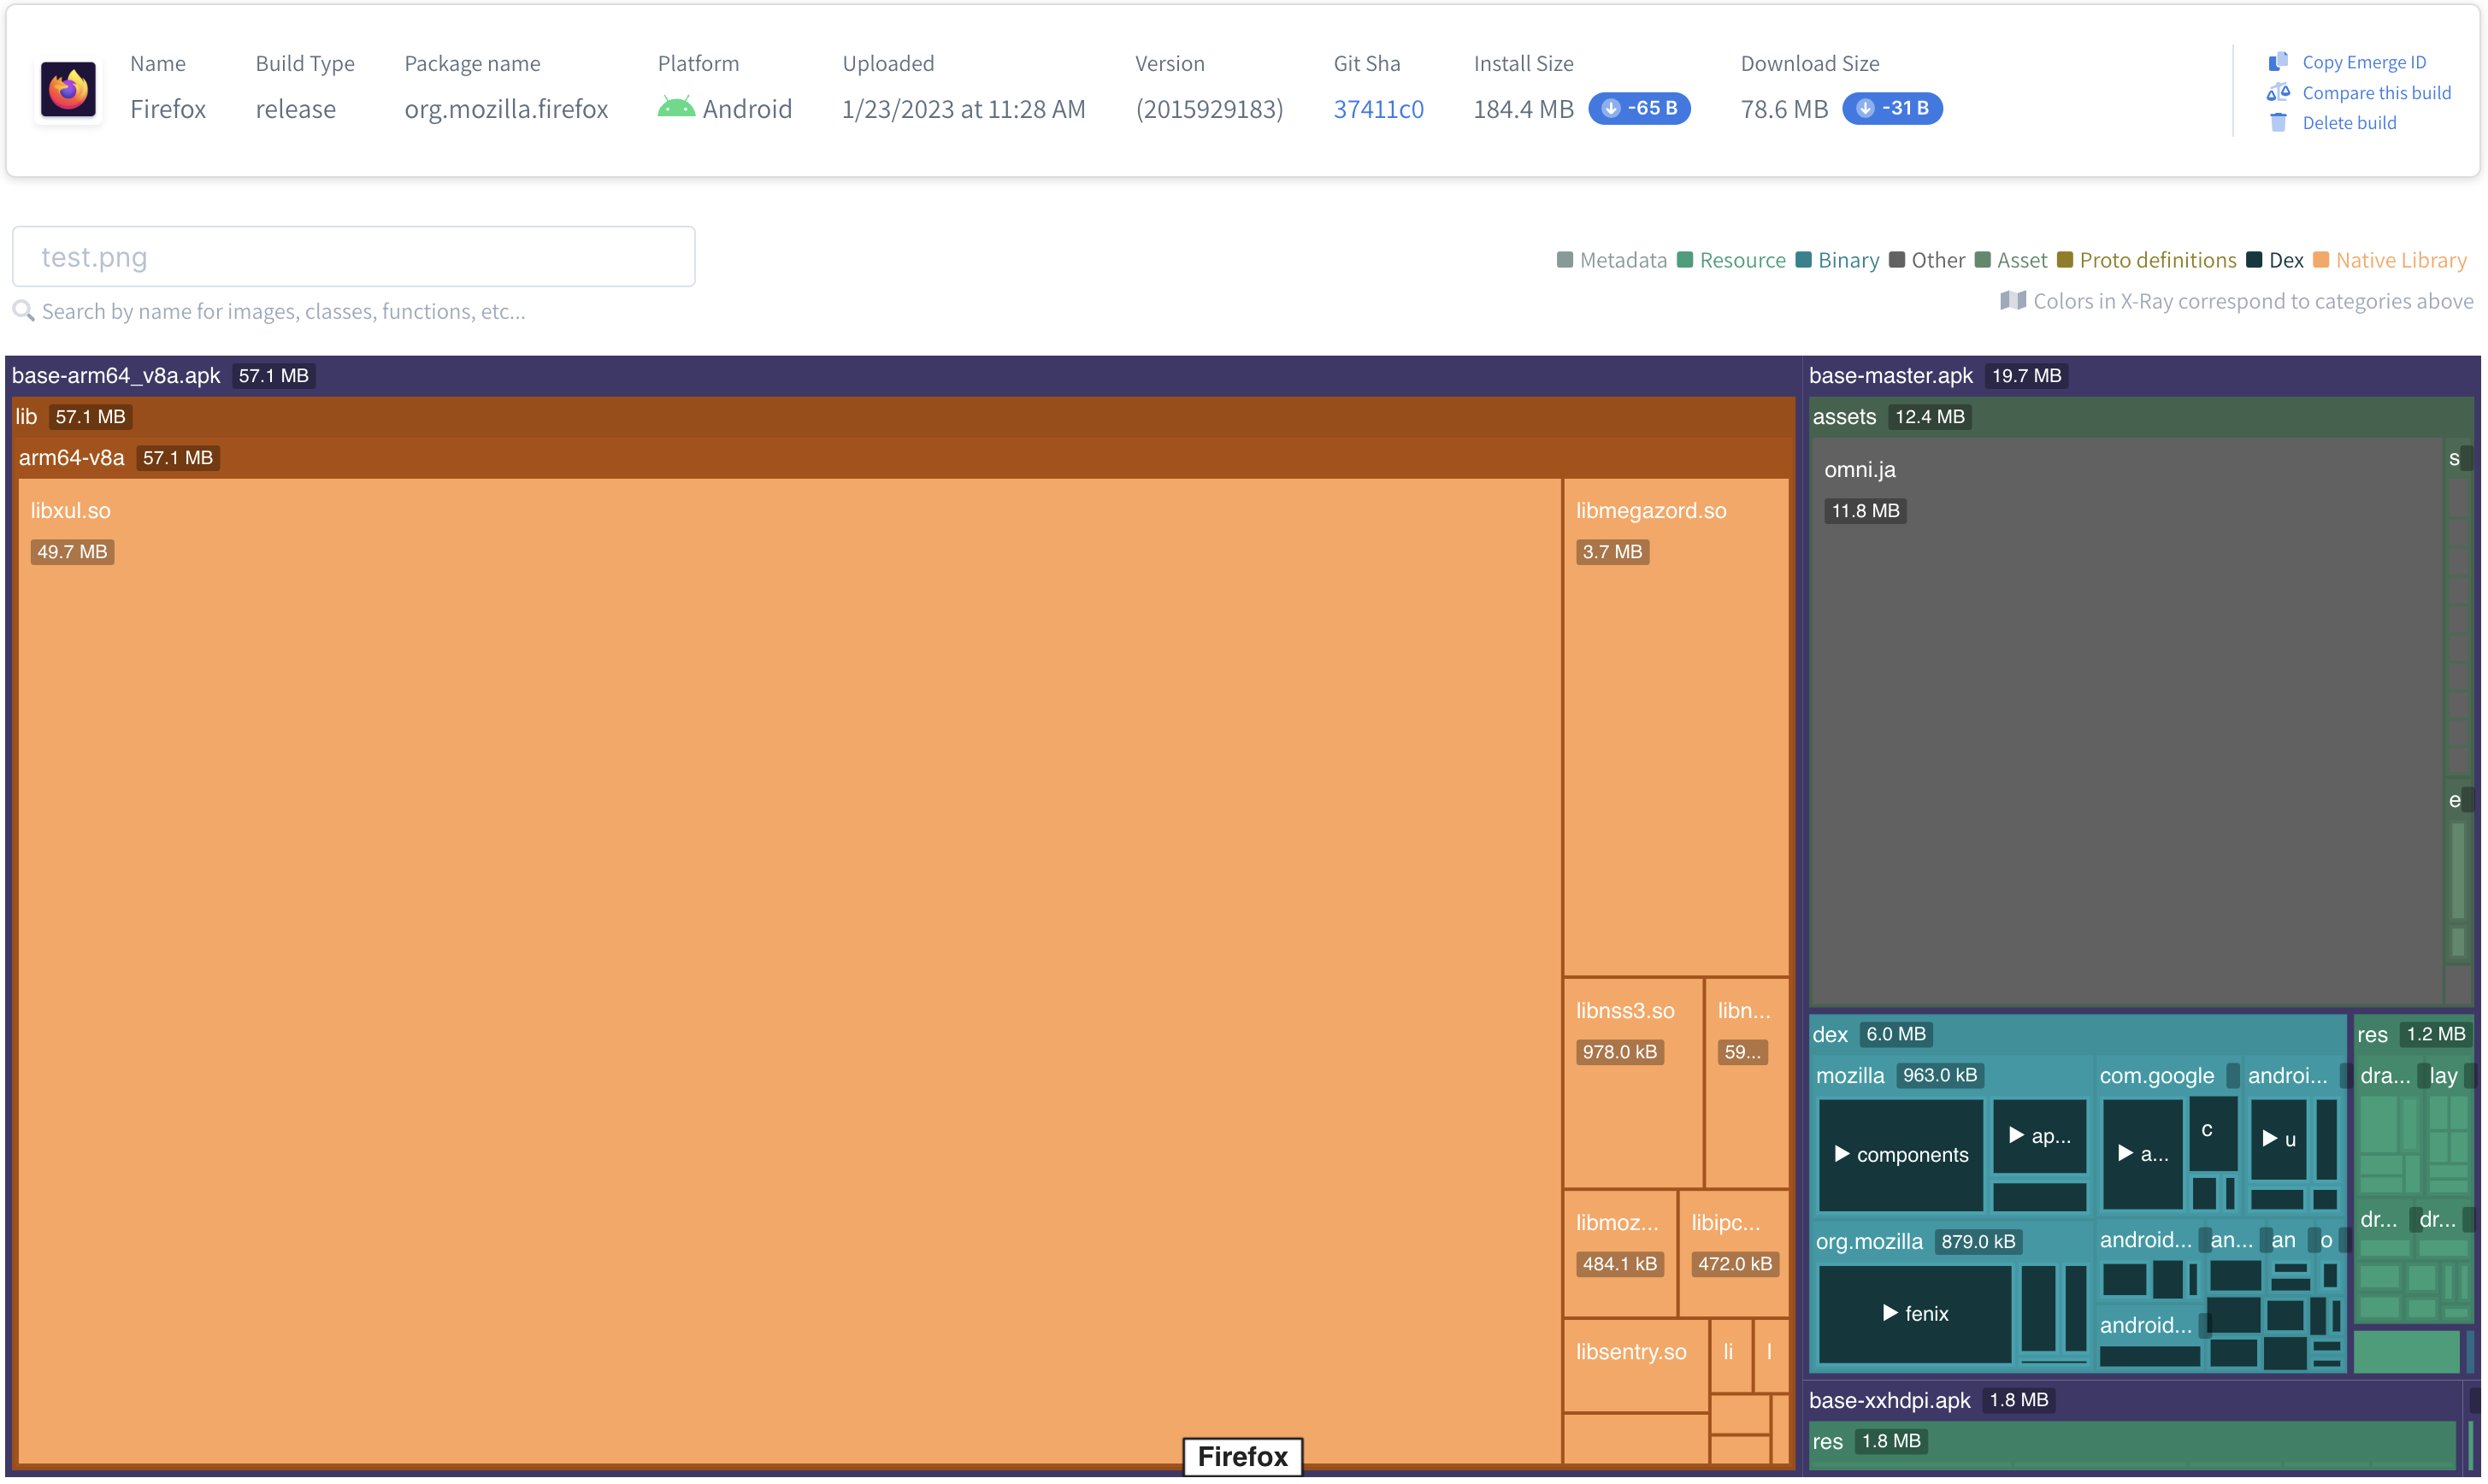
Now that we have a build let's run our first app launch test!
Comparing App Launch Across Builds
Emerge's Performance Analysis tooling centers around the ability to accurately compare performance flows for any two builds. Comparisons are used to:
- Highlight and quantify performance improvements
- Catch regressions prior to merging
- Trace issues to the change that introduced them
To demonstrate, we made a simple code change that adds an SDK to be initialized during application creation.
1open fun setupInMainProcessOnly() {
2    // …
3    setupLeakCanary()
4    startMetricsIfEnabled()
5    setupPush()
6    migrateTopicSpecificSearchEngines()
7    MockSdk.initialize()
8    // …
9}
10
Builds can be automatically compared in your CI workflow or you can use our Compare page to start an ad-hoc comparison between any two builds. By default, you can run an app launch test on any build using time to initial display as the marker (we'll walk through running custom tests later). In this case, we'll upload the new build of Firefox and kick off an App Launch comparison.
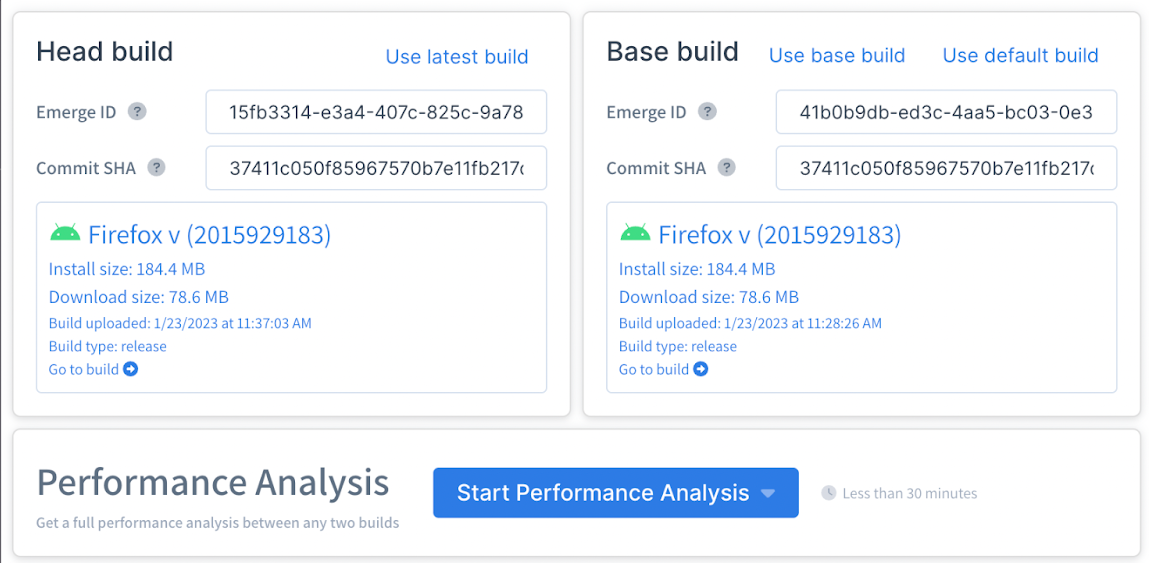
Every performance test will return
- An overall conclusion to show how the two builds compared
- A differential flame chart, showing where changes occurred (if any)
For our differential flame charts, each frame in the head build is compared to the corresponding frame in the base build. The relative and absolute difference is calculated as the difference between each frame. Frames are colored red to indicate a regression and green for an improvement.
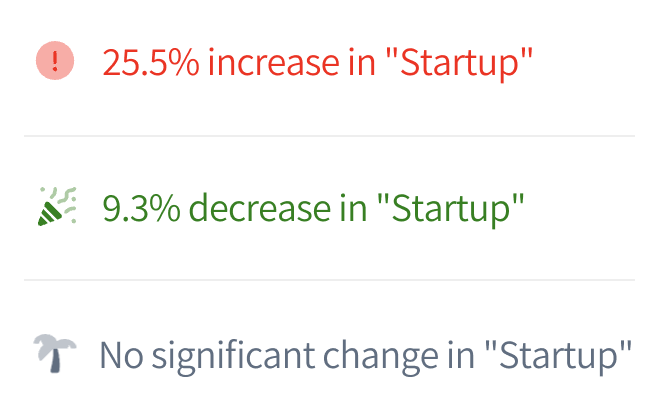
In the Firefox app launch comparison, we see the overall app launch duration increased by 25.5%. Diving into the flame chart, we can "follow the red" down the call stack to trace the regression to MockSdk.initialize.
Maybe we initialize this new SDK asynchronously, or maybe it’s important enough that it’s worth slowing down the app launch. In any event, using Emerge can help ensure that important performance changes are always measured and intentional. This brings us to…
Custom Performance Tests
App launch speed is very important but it’s generally not the only flow that has an impact on UX. Let’s write a custom performance test for another flow in the Firefox app: when a user taps the address bar, enters a URL and waits for it to load.
Let’s create a new Gradle subproject for our tests. First, we’ll choose a path for it:
1// Top-level build.gradle
2
3emerge {
4    appProjectPath = ':app'
5    // arbitrary name b/c project doesn't exist yet
6    performanceProjectPath = ':performance'
7    apiToken = System.getenv("EMERGE_API_KEY")
8}
Next we’ll let the Emerge Gradle plugin generate the subproject for us:
./gradlew emergeGeneratePerformanceProject \
    --package org.mozilla.fenix.performance
This creates and configures the project for us, including an example test:
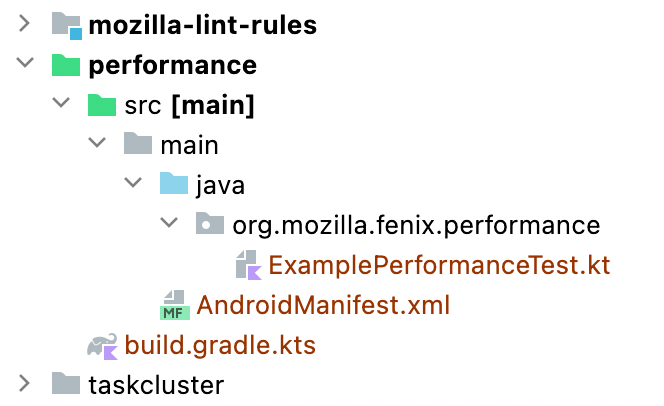
Emerge uses 3 annotations, similar to JUnit, in order to configure custom performance tests: @EmergeInit, @EmergeSetup and @EmergeTest. The example test explains how they work in detail, but here’s a quick overview:
@EmergeInit
@EmergeInit runs once per app install. Typically this is used to login in order to test flows for registered users. With Firefox we don’t need to login in order to test loading a webpage so we can skip this function entirely.
@EmergeSetup
@EmergeSetup runs once before each test iteration. This is meant to get the app in the right state before beginning the performance recording. In this case we want to measure the performance of loading a webpage, not launching the app and then loading a webpage, so we’ll launch the app as part of the setup.
@EmergeSetup
fun setup() {
    val device = UiDevice.getInstance(InstrumentationRegistry.getInstrumentation())
    device.pressHome()
    device.wait(Until.hasObject(By.pkg(device.launcherPackageName).depth(0)), LAUNCH_TIMEOUT)
    val context = ApplicationProvider.getApplicationContext<Context>()
    val intent =
        checkNotNull(context.packageManager.getLaunchIntentForPackage(APP_PACKAGE_NAME)) {
            "Could not get launch intent for package $APP_PACKAGE_NAME"
        }
    intent.addFlags(Intent.FLAG_ACTIVITY_CLEAR_TASK)
    intent.addFlags(Intent.FLAG_ACTIVITY_NEW_TASK)
    context.startActivity(intent)
    device.wait(Until.hasObject(By.pkg(APP_PACKAGE_NAME).depth(0)), LAUNCH_TIMEOUT)
}
@EmergeTest
@EmergeTest defines the UI flow to be tested. @EmergeSetup runs prior to the test so when @EmergeTest starts we are already on the app’s home screen. Our test will consist of:
- Clicking the address text field.
- Entering the address of a predetermined website.
- Pressing enter to start loading the page.
- Waiting for the progress bar to appear and disappear to indicate the page is done loading.
@EmergeTest
fun myPerformanceTest() {
    val device = UiDevice.getInstance(InstrumentationRegistry.getInstrumentation())
    device.findObject(UiSelector().text("Search or enter address")).apply {
        click()
        text = "https://www.emergetools.com"
    }
    device.pressEnter()
    device.findObject(UiSelector().className(ProgressBar::class.java)).apply {
        waitForExists(1_000)
        waitUntilGone(10_000)
    }
}
Note: One constraint is that tests must be written with UI Automator, rather than frameworks like Espresso which can degrade performance during tests.
Let’s try to run it locally:

./gradlew emergeLocalReleaseTest
…

┌──────────────────────────────────────────────────────┐
│ org.mozilla.fenix.performance.ExamplePerformanceTest │
└──────────────────────────────────────────────────────┘
 ├─ No @EmergeInit method
 ├─ @EmergeSetup setup ✅
 └─ @EmergeTest myPerformanceTest ✅
Running an Emerge test locally doesn’t test performance, it simply ensures that performance tests can run as expected. Now that we know they do, we can test our custom flows whenever a new build is uploaded!
What's next?
And that's it!
Our testing suite is built to control everything about the app's environment, so the only changes measured will be changes from within the uploaded app. We've abstracted away much of the difficulties of performance testing so developers can focus on maintaining meaningful tests.
There's much we didn't get to cover, like our performance insights, which automatically identifies and suggests performance improvements, and our managed baseline profile offering.
If you’d like to learn more about Emerge’s performance testing suite for your app you can get in touch with us or explore our documentation on our mobile products.
Share on Twitter
