In my last two posts I wrote about pre-main startup time, and how app size has a direct impact on how much work dyld does to initialize your app. In this post I’ll take a closer look at a Swift runtime feature, protocol conformance checks, to see how this common operation slows down post-main time as your binary size increases.
The first hint that this might be a cause for concern in app performance comes from the Swift 5.4 release notes:
In Swift 5.4, protocol conformance checks at runtime are significantly faster, thanks to a faster hash table implementation for caching previous lookup results. In particular, this speeds up common runtime
as?andas!casting operations.
Protocol conformance checks are when the runtime needs to look up if a variable conforms to a protocol. In your code
this looks like myVar as? MyProtocol. Note that as? operations can also be used to cast variables to
non-protocol types, and these do not cause a protocol conformance check. This is part of the dynamic nature of
the Swift runtime. The as? operator indicates that a runtime cost will be paid for not guaranteeing the type at
compile time.
From the release notes we know as? operations were slow enough that there was room to be “significantly” faster,
but how slow are they exactly? Since a faster cache speeds it up, when do we hit the un-cached state and how slow is
that? I used the performance test visualizations in
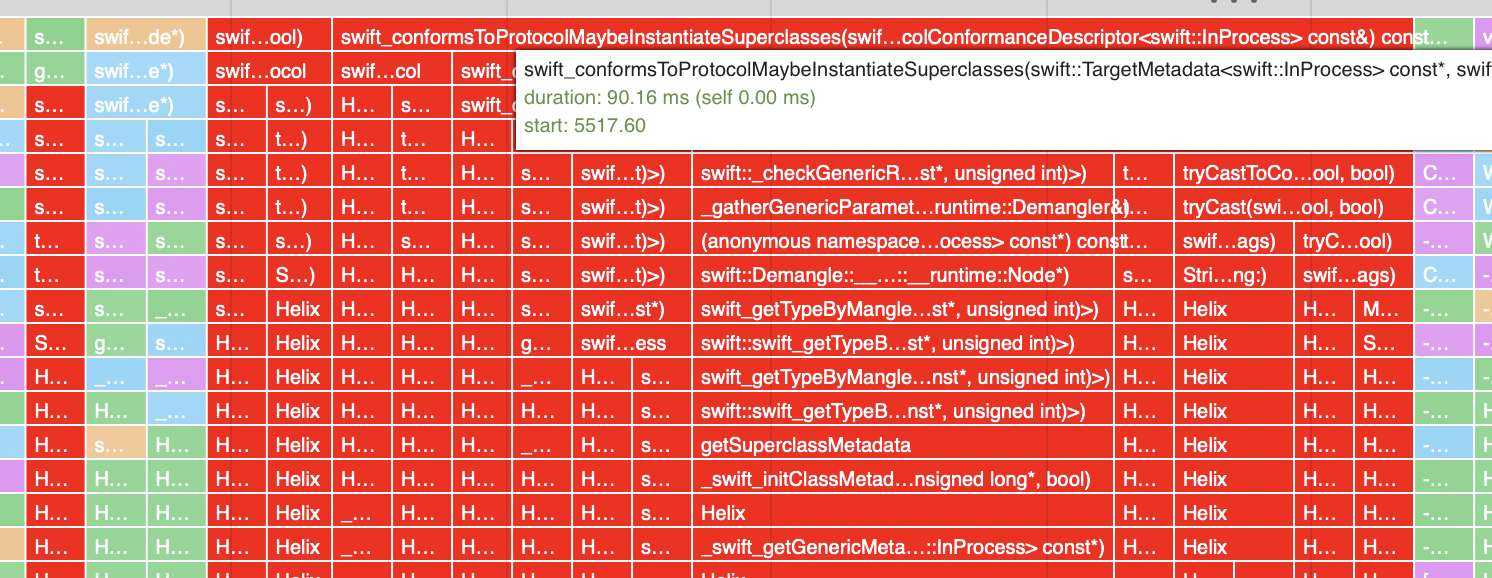
Emerge to see if this would show up in stack trace samples of Swift apps... and sure enough... 👀 spotted! You can
see below that swift_conformsToProtocol is taking 100+ms of app launch time.

Let’s look at the Swift source code to see what causes the slowdown and how much time it takes in practice. Then we'll discuss strategies to avoid this in your app, and even implement a faster replacement for the Swift runtime.
What happens when you check a protocol conformance?
The entry point to our investigation is Mike Ash’s PR which implements a 13x faster cache that was released in Swift 5.4. From here you can see where the new cache is defined:
struct ConformanceState {
   ConcurrentReadableHashMap<ConformanceCacheEntry> Cache;
...
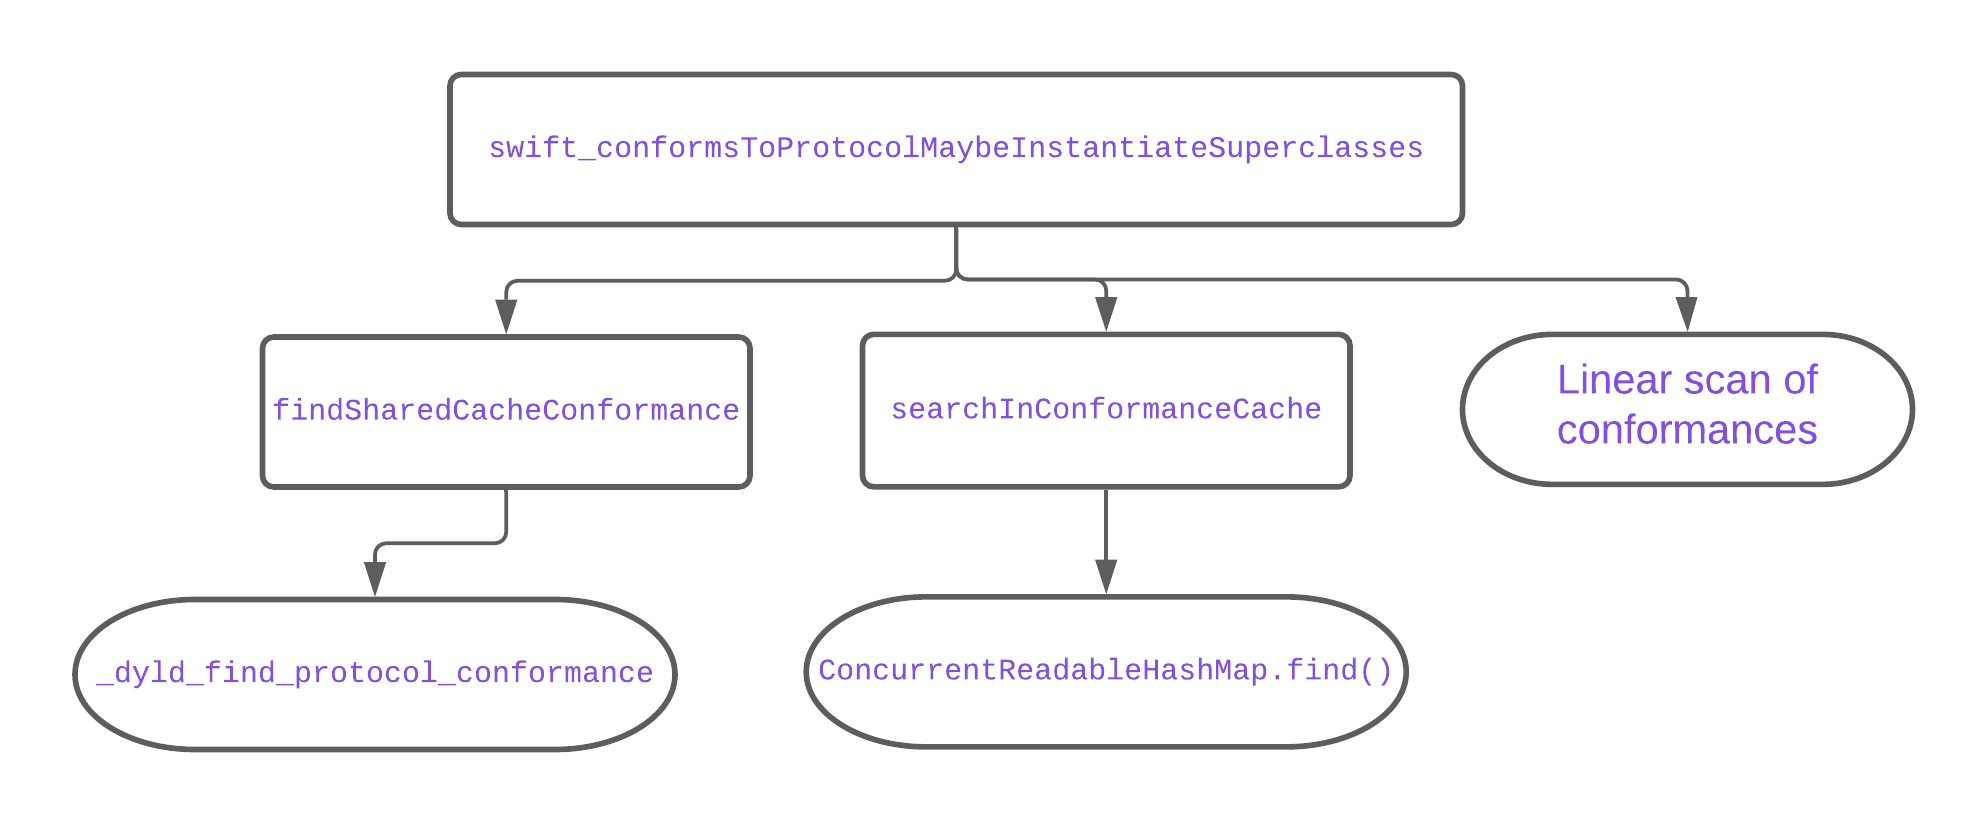
The latest version of the code is ProtocolConformance.cpp in the function swift_conformsToProtocolMaybeInstantiateSuperclasses, where most time is spent based on the startup time visualizations. There are three high-level paths through this function, creating a 2 level cache followed by a slower full search for the conformance.

_dyld_find_protocol_conformance: Before consulting the ConcurrentReadableHashMap added in Swift 5.4, the runtime will check a cache managed by dyld. Presumably this allows the cache to be persisted between launches of the app. Support for this cache was added in iOS 15, and you can confirm the function is present in dyld usingnm /usr/lib/dyld | grep _dyld_find_protocol_conformance | c++filt. Unfortunately, Swift imports this from dyld_priv.h so we can’t look at the implementation until Apple releases sources for the latest OS versions. You can set a symbolic breakpoint on this function and verify in a test app that it’s always called when usingas?. It seems to be a work in progress, because in practice the second cache is always consulted (verified using another symbolic breakpoint).ConcurrentReadableHashMap.find()Next the runtime checks the cache added in Swift 5.4, an in-memory cache that is not persisted between multiple runs of the app. You can verify it’s called by placing a symbolic breakpoint on_ZN5swift25ConcurrentReadableHashMapIN12_GLOBAL__N_121ConformanceCacheEntryENS_11StaticMutexEE4findINS1_19ConformanceCacheKeyEEENSt3__14pairIPS2_jEERKT_NS4_12IndexStorageEmS9_. This is the C++ mangled symbol[1] name for the function that takes aConformanceCacheKeyand returns aConformanceCacheEntry. Looking at the definition of the cache key we can see it’s based on the conforming type and the protocol
struct ConformanceCacheKey {
  const Metadata *Type;
  const ProtocolDescriptor *Proto;
This means the cache key is specific to this type/protocol pair, multiple conformance checks for the same protocol but different types (or vice versa) won’t hit the cache. This can also be verified with symbolic breakpoints.
- The linear scan is a worst case, but is always done for each type/protocol pair before the cache is populated. Swift creates a special mach-o section
__TEXT.__swift5_protowhich is a list of pointers to each protocol conformance record in the binary. A conformance record is generated for every type/protocol pair, and allows the runtime to determine which conformances are in your app. This kind of binary metadata is the basis for how Emerge Tool’s analysis works, we use it to attribute parts of your source code to binary size.[2] The scan of all conformances is done for every loaded dylib in your app, including frameworks or system libraries like the Swift standard library itself. This means a single conformance lookup is O(n) and looking up every possible conformance is O(n^2), not great for performance!
How slow is it really?
We now see that the speed of protocol conformance lookups is dependent on the number of conformances in your app. This will be influenced by how many Swift libraries you link to, and how many conformances you include in your own code. otool -l Helix.app/Helix | | grep _swift5_proto -A 4 tells us Uber’s app has a 411200 byte protocol conformance section. Each 4 bytes is a relative pointer so 411200 / 4 = 102,800 conformances. Based on this the test bed for my experiments is an app with 100k conformances. The classes were codegened, each conforming to the same protocol. All tests were performed on an iPhone 7 running iOS 15.1
Test 1: First conformance check The first time you perform a conformance check all the virtual memory for sections of your app binary containing protocol runtime metadata needs to be paged in. With 100k conformances this is a significant cost and makes the first conformance check much slower, ~20 milliseconds in my tests.
Test 2: Cache miss If the second conformance check is for a new type it will be uncached and still require the full scan of conformances, but this time it won’t cause any page faults. This took about 3.8 milliseconds in my tests. It may not seem like much, but it’s already 23% of the 16 milliseconds you have between frames on a 60fps device. These can add up to a substantial amount of time when multiple uncached protocol checks are performed.
Test 3: Cache hit
To measure the time of the ConcurrentReadableHashMap we simply do the same as? operation in a loop and average the time it takes. As expected it’s very fast, about 0.0004 milliseconds. Once the cache is populated, protocol conformance checks aren’t a major bottleneck to performance, that’s why it’s particularly problematic during app launch when the cache is empty.
Test 4: Negative result The runtime loop that runs for each conformance has an early return that avoids most of the work if the protocol being checked isn’t equal to the protocol in a conformance record. To test the impact of this, I measured the time it takes to run a conformance check on a protocol that wasn’t the one conformed to by my 100k generated classes. It still took a significant time, 0.9 milliseconds, but this best-case time is ¼ of the previous worst case.
These tests provide some insight into the variation you’ll see with protocol conformance checks, but to really understand their impact I uploaded a few large Swift apps from the app store to Emerge and used the inverted flamegraph view to get a ballpark estimate of the time spent checking protocol conformance during app launch. Consistently over 100ms was spent in conformance checks for apps like Uber, DoorDash, and Grab.

When does this happen?
We already saw that apps pay the price for slow conformance lookups when doing an as? operation, but you can encounter the same performance hit with an as!. Swift verifies whether or not the protocol is satisfied when you use as! and will always abort or continue.
Generic type metadata is another source of protocol conformance checks. You’ll encounter a conformance lookup with code as simple as this:
class Test<T: Decodable> {}
let _ = Test<Int>.self
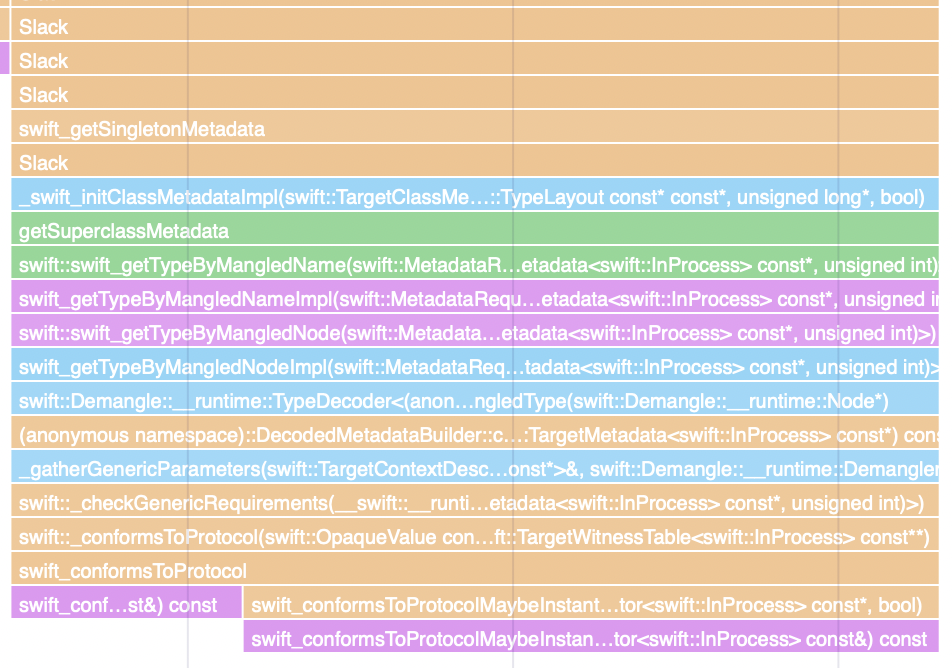
Joe Groff explains in this thread that Swift generates runtime metadata for the type from a mangled name in the binary. This demangling requires conformance lookups. You can see this kind of stack trace frequently in a Swift app launch, here’s an example that came from launching the Slack app with Emerge Tool’s app launch instrumentation:

Both JSON decoding and string interpolation also lead to as? operations. String interpolation calls _print_unlocked which has 3 conformance checks and uses Mirror, internally performing even more conformance checks. The combined effect of this is a big hit to app performance.
Strategies to help improve app performance
The two ways to approach improving app performance from protocol conformance checks is to minimize the number of conformance and as? operations. Emerge Tool’s app size analysis can help with both of these. We’ve always known app size is a leading indicator for app quality, and it’s demonstrated clearly here in the case of protocol conformances. By focusing on binary size reductions you’ll remove conformances from your app, and make the runtime faster.
One source of low hanging fruit that might be in your app is removing protocols that are used only for providing stub implementations in unit tests. These can be compiled out of release builds of the app to avoid them being included in runtime metadata.
TIP: Over in Objective-C land, there was an attribute added to clang earlier this year objc_non_runtime_protocol which instructs the compiler to not emit any metadata for a protocol. This reduces app size and improves runtime performance, if you know the protocol is only used at compile time. More detail is available in the attribute reference.
Profiling your app using tools like Instruments or the Emerge startup time visualization can help you identify where conformance checks are most often used in your app. Then you can refactor code to avoid them entirely. Consider these examples:
In the second case, as long as the compiler knows the type of event at the callsite, it avoids the dynamic cast entirely.
As a concrete example, this commit re-writes a small portion of code in the animation framework, Lottie, to avoid 22 possible conformance checks. There were 11 animation node types, each of which could have been checked against 2 protocols depending on what kind of animation was being loaded. The change easily bypasses dynamic casts, allowing the compiler to guarantee protocol conformance.
Implementing a faster runtime
At the lowest level the app binary is storing protocol conformances in a list, so there isn’t a way to do a complete conformance check without an O(n) scan through the whole list. However, that doesn’t mean we can’t convert the list into a data structure better suited for our needs. With so much of app launch time tied up in protocol conformance checks, we could bypass the runtime entirely and make our own data structure that allows for faster conformance checks. So that’s what we did.
The concept behind zconform is to eagerly load all possible protocol conformances and store them in a map keyed by the protocol’s address in memory. The value for each entry is a set holding the addresses of all conforming types. If a given type isn’t found in the cache, we know it’s not possible for the conformance to succeed and can early return nil without the as? operator.
Zconform initialization uses getsectiondata to retrieve the address and size of TEXT.__swift5_proto for each mach-o image, then follows the chain of pointers to build up an unordered_map as the cache.
To check a conformance, input types are cast to their runtime representation using unsafeBitCast. The representations of these types in memory is found by examining the swift ABI, for example ExistentialTypeMetadata. Since you can compose protocols like typealias MultipleProtocols = MyProtocol1 & MyProtocol2, we loop over the number of protocol conformances and validate each one.[3]
Some details are left out in this example, but it‘s all available in the GitHub project.
My benchmarking shows a 3 millisecond overhead to build up this cache. If your usage pattern matches what’s being optimized here, many conformance checks that may result in nil, it can entirely eliminate the worst case 3.8 milliseconds for as? we measured previously. The project is a proof of concept, and there are still some features necessary for a full rollout. It only supports checking conformance of structs to non-class bound protocols.
Support for more cases can be added, if you’re interested in using this for your app you can get in touch with the Emerge team.
[1] Symbol name mangling converts the human readable function name to the format stored in a binary symbol table.
[2] There is a bit more detail on runtime metadata layout when we build our own conformance check function, but if you're interested in all the details of metadata in the binary check out this post by Scott Knight.
[3] For an introduction to these runtime metatypes and the difference between existentials and protocols see this post by Bruno Rocha.
Share on Twitter


